Dashboard Statistics Summary
The "This Period's Statistics" display, found on the Affiliate Dashboard, provides affiliates with a variety of displays and breakdowns for the statistics that they record in with their affiliate promotions. This works along with the Key Statistics section of the page to help affiliates get a full perspective of their statistics, and how their promotions are faring.
Use the provided "View as:" icons in the top-right corner of this section to see your current period's statistics through various different views. This includes a statistics table, line graphs and bar graphs, RSS feeds, and XML dumps.
The following sections explain all of these different statistic views in more detail.
Table View
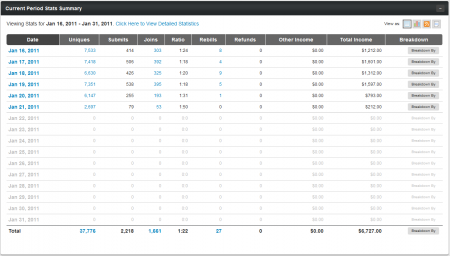
The Table View for the "This Period's Statistics" section provides you with essential affiliate statistics for your current pay period (of 15 days), broken down by Date. Click the "Click Here to View Detailed Statistics" hyperlink to see the affiliate statistics report for that particular date range, where you can see the statistics you've generated in full detail.
Clicking any of the hyperlinked statistics in this table lets you see a full breakdown of what makes up that stat, bringing you to a detailed affiliate statistics report where you can analyze everything that makes up that particular statistic. You can see in-depth views of your unique hits, join hits, and rebills through this table.
You can also break down your displayed statistics even further with the "Breakdown By" icons on the right side of this table. This lets you break down all the statistics you recorded for any date listed here by Site, Program, Campaign, Traffic Tag, Demographic, Ad Tool, and Referring URL. Just click the statistic category you want to break down that date by, and you'll be taken to an affiliate statistics breakdown for that stat.
Graph View
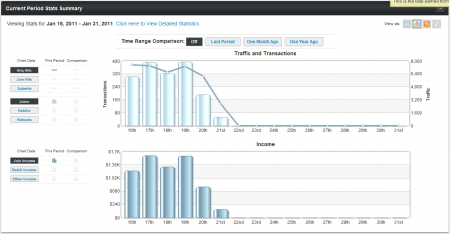
The Graph View available in the "This Period's Statistics" section lets you see a visual display of your affiliate statistics, letting you analyze trends in your statistics and promotions. You'll find two separate graphs in this section, both of which contain a great deal of different viewing options -- these let you see statistics from different categories and date ranges here.
In order to help you compare various statistics relating to your promotions, you can view multiple graphs overlaid on top of each other in this section. For example, you can display graphs for your unique hits, join hits, joins, and submits in the same section, letting you see a visual comparison of how well you're doing with converting surfer traffic.
Use the "Traffic and Transactions" graph to see your unique hits, join hits, and/or join page submissions in comparison to your member joins, rebills, and/or refunds. Just click the icons to the left of this graph to show a visual display of any statistic available here.
Use the "Income" graph to see a visual display of how much your referrals have actually earned for the programs you're promoting. You can see graphs of your join income, rebill income, and/or other income here, so that you can view and compare your various sources of income. Click any of the available statistics here to toggle their graphs on or off.
You'll also see some "Time Range Comparison" icons here, which let you compare statistics generated during the current pay period to statistics from a previous pay period. This lets you see a quick display of how your current affiliate promotions are doing in comparison to past promotions. Just click any of the icons to compare your current stats to statistics from Last Period, One Month Ago, or One Year Ago.
RSS Feed
Click the “View as an RSS Feed” icon to download a record of your statistics from the current NATS pay period displayed in RSS form. This lets you receive instant updates when you record new referral statistics, which lets you stay on top of your promotions.
You'll see your affiliate statistics shown in an RSS format once you click the "View as an RSS Feed" icon. To subscribe to this feed and get updates of your statistics, just copy the feed's URL from your address bar, then paste it into an RSS reader of your choice (for example: RSSdish).
XML Dump
You can also download a record of your affiliate statistics with the “Export as XML” icon in this section. Downloading an XML Dump lets you see records of your statistics through external readers like spreadsheet programs, which allows you to keep your own detailed records of your affiliate promotions.
You'll see a new window pop up with the XML values included in your statistics dump once you click the "Export as XML" icon. Right-click on this page, then click "View Page Source" to see your stats dump organized by variable name. This lets you match up every number in your XML dump with the relevant statistic. Save this page to view your statistics in an external program of your choice.

