Difference between revisions of "Affiliate Dashboard Statistics Summary"
TMMStephenY (talk | contribs) (Created page with '{{NATS4 Manual | show_for_affiliates_section = true }} '''Note: This article only applies to NATS version 4.1 and higher. If you wish upgrade your installation of NATS t…') |
TMMStephenY (talk | contribs) |
(No difference)
| |
Revision as of 14:10, 2 February 2011
Note: This article only applies to NATS version 4.1 and higher. If you wish upgrade your installation of NATS to take advantage of this feature, please put in a support ticket.
While the Key Statistics section of the Affiliate Dashboard is very useful for monitoring the raw numbers of your affiliate promotions, it can sometimes be difficult those statistics put them in context from what is provided.
The "Current Period Stats Summary" was designed with this in mind, and provides you with various displays and breakdowns of the statistics affiliates record in their respective programs.
Changing Your Stats Display
Using the provided "View as:" icons in the top-right corner of this section allows you to see your current period's statistics through various views, including a table, graph, RSS Feed, and XML Dump.
Table View
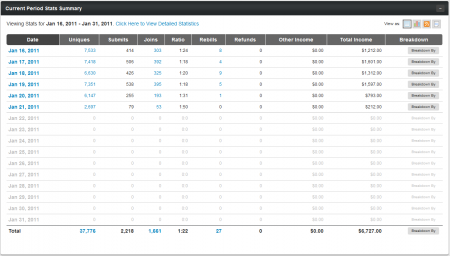
The Table View for the "Current Period Stats Summary" section provides you with assorted affiliate statistics for that pay period (of 15 days), broken down by Date.
The "Click Here to View Detailed Statistics" hyperlink brings you to the affiliate statistics page for that particular date range, and clicking any of the available hyperlinks on the table bring you to a breakdown of that particular statistic. For example, clicking any of the listed dates will take you to a breakdown of statistics recorded on that date.
This table also offers many other ways to break down the provided statistics -- mousing over the "Breakdown By" icons will reveal assorted ways to see different stats views. You can break down the stats for a single day by: Site, Program, Campaign Tags, Demographic, Ad Tool, and Referring URL.
Graph View
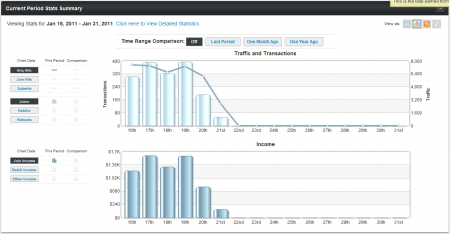
The Graph View offers a visual method of analyzing your affiliate statistics and trends. This view offers two graphs, which contain a great deal of different viewing options, which allow you to see various different statistics and date ranges here.
The "Traffic and Transactions" graph lets you view your unique hits, join hits, and/or join page submissions in comparison to your member joins, rebills, and/or refunds. Simply click the icons to the left of the graph to have it to toggle the particular stats you want to see on or off. You can choose how many statistics you wish to view in the graph, from only one statistic to all three available stats.
For example, you can view your unique hits and join hits superimposed over total joins, in order to see how successful your promotion is at converting surfers.
The "Income" graph provides a method of visually seeing how much you've actually made for your program(s). Here you can choose to display your join income, rebill income, and/or other income in order to compare your various income sources.
You can also compare your current period's statistics with a previous pay period's statistics with the "Time Range Comparison" feature. Here you can choose statistics from "Last Period," "One Month Ago," and "One Year Ago" to be compared on the graphs, letting you see how your promotions are doing in comparison to past periods.
RSS Feed/XML Dump
Both the RSS Feed view and the XML Dump view provide methods of storing and viewing your statistics through external methods, such as RSS Readers (like RSSdish) and Spreadsheet programs (like Microsoft Excel). Simply click the "View as RSS Feed" or "Export as XML" icons to view or download the necessary data.

