Affiliate Statistic Views
The Affiliate Statistics reports provide a variety of different ways to view and analyze your statistics, including tables, graphs, RSS feeds, and XML dumps.
Accessing these different views is easy -- just use the "Statistics" menu to find the specific statistics report you wish to view, and scroll down to the stats display. In the top-right corner of that section, you will see a series of "View as:" icons. Use the provided "View as:" icons to change the way your statistics are displayed on the page.
Table View
The Statistics table provides detailed statistics based on the date range and statistic filters you set above, displaying a breakdown of relevant stats for that Statistics report. This includes Raw Hits, Unique Hits, Join Hits, Submits, Joins (and join income), Unique Ratio (measures unique hits to joins), Rebills (and rebill income), Refunds (and refund income), Other Income, and Total Income from promotions.
Clicking any of the hyperlinked stats brings you to a detailed breakdown of that particular statistic, allowing you to see the individual elements that make up that statistic. Clicking on a column header sorts all available statistics by that column value, allowing you to sort your overall stats by a certain statistic.
Graph View
NATS also provides breakdowns of statistics in graph form, for affiliates who want to see a visual representation of their stats.
The type of graphs in the graph view vary based on which statistics report you view. NATS contains four separate graph views -- line graphs, pie charts, bar graphs, and region maps. This allows for views that are better tailored for certain statistics, as well as providing an array of breakdowns to view.
All of these graphs can be adjusted to display a variety of information in different configurations by using the available buttons next to the graphs. While each graph has the same button options, they vary slightly depending on the affiliate graph you are viewing.
Each graph provides three statistical categories -- hits, transactions, and income -- which can all be displayed on the same graph together.
The Hits graph can be modified to show unique hits, join hits, and submits by clicking the available buttons to the left of the graph. The Transactions graph can be adjusted to reflect joins, rebills, or refunds in the same manner. Finally, you can adjust the Income display to show your join income, rebill income, or other income. When you do so, the graph will automatically adjust itself to reflect your changes.
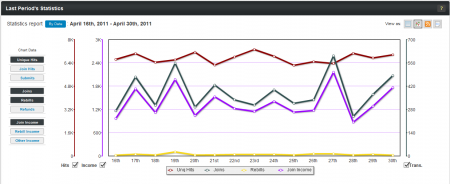
Line Graph
The Line Graph view can be found on the Statistics By Date report, as well as the Other Income report.
You can remove the displays for hits, income, and transactions on this graph if you choose, providing a singular (or dual) line chart view. Simply click the hits, income, or transactions checkboxes to remove or re-add those line graph displays.
This graph also provides fully adjustable date ranges with the date bar at the bottom, which provides a quick view of statistics logged over the current month. You can adjust the dates that are used in the line graph by simply clicking and dragging the highlighted date range to the left or right, and you can adjust the range of dates displayed by clicking and dragging either the left or right edge of the highlighted portion.
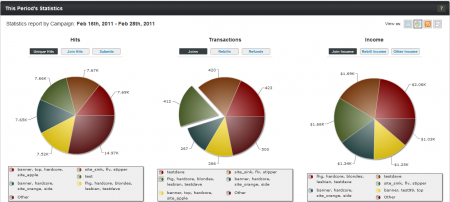
Pie Chart
The Pie Chart view can be found on the Statistics By Site, Statistics By Campaign, Statistics By Program, Statistics By Demographic, and Statistics By Ad Tool reports.
In this graph view, the hits, income, and transactions statistics are all separated into individual pie charts. You can change the statistics displayed in these charts in the same manner as the other views -- simply click the provided buttons, which can be found on top of each provided graph.
Clicking any section of the provided pie charts separates it from the rest of the chart -- this provides an easy way to isolate certain stats and get a detached visual representation of those stats. You can also click the titles of the displayed stats to separate that particular statistics -- these can be found under each pie chart.
Bar Graph
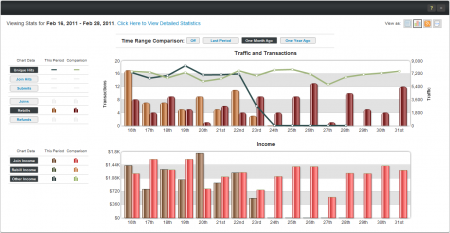
The Bar Graph view can be seen on the Affiliate Dashboard, and provides two breakdowns. Traffic (Hits) and Transactions make up the first breakdown, and Income makes up the other.
The Traffic and Transactions breakdown allows you to view every available statistic overlaid on the same graph, if you so choose. Clicking on any of the available hits or transactions buttons adds or removes that particular stats display, which can all be toggled on or off. Unlike the other graph views, these statistic displays can all be seen on the same graph at once.
The Income graph allows the same actions -- just click on a desired statistic to add or remove it from the graph.
You can also compare your current pay period's statistics to a previous time period with the Time Range Comparison buttons at the top of the section. This provides you with displays for both chosen pay periods. You can compare your current statistics with statistics from last period, one month ago, or one year ago -- simply click the time period you want to compare your current statistics with.
Region Map
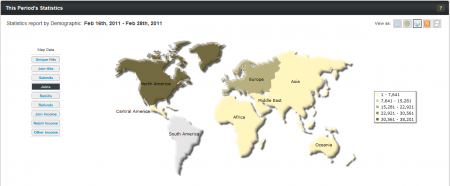
The Region Map view is available on the Statistics By Demographic report, and provides a breakdown of statistics recorded, sorted by global regions.
You can choose one of the available statistics to display from the provided list -- this contains unique hits, join hits, submits, joins, rebills, refunds, join income, rebill income, and other income.
Each region on the provided map will be color-coded, based on the number of statistics that were recorded for that region. Darker colored regions have higher numbers of statistics recorded, while lighter colored regions have less. The map also provides a breakdown of the color-coding, which can be seen to its right side.
Clicking any of the available regions takes you to a more specific breakdown of that region, where you can select individual countries to view statistics for. Once you have narrowed down your selection to a country, you can view the Statistics By Date report for surfers from that country only.
RSS Feed/XML Dump
Both the RSS Feed view and the XML Dump view provide methods of storing and viewing your statistics through external methods, such as RSS Readers (like RSSdish) and Spreadsheet programs (like Microsoft Excel). These dump options can be found on every available statistics report, other than Affiliate Referrals.


