Nats display graph
From TMM Wiki
Jump to navigationJump to searchnats_display_graph
Displays a graph of affiliate statistics.
Alias: display_graph
Parameters
(Required parameters in bold)
| Parameter | Description | Possible Values | Default Value | Example |
|---|---|---|---|---|
| width | Width of the graph in pixels | Any whole number greater than 0 | 400 | width="800" |
| height | Height of the graph in pixels | Any whole number greater than 0 | 250 | height="800" |
| period | The period to get statistics for | Any valid period number or string description | 0 or date | period="7" or period='week' |
| stats | The variable to get statistics from | An array | $stats[$range] | stats=$stats['date'] or $stats['site'] |
| bgcolor | The background color for the graph | Any background color specification | 0xe7e9eb | bgcolor="green" |
| plot_bgcolor | Background color for the plot | Any background color specification | Transparent | bgcolor="blue" |
| img_width | Width of the image in pixels | Any whole number greater than zero | Same as width parameter above | img_width="800" |
| img_height | Height of the image in pixels | Any whole number greater than zero | Same as height parameter above | img_height="800" |
| plot_width | Width of the plot in pixels | Any whole number greater than zero | Same as width parameter above | plot_widht="800" |
| plot_height | Height of the plot in pixels | Any whole number greater than zero | Same as height parameter above | plot_height="800" |
| legend_bgcolor | Background color of the legend | Any color specification | Transparent | legend_bgcolor="green" |
| plot_left_margin | Left margin of the plot in number of pixels relative to the border | Any whole number greater than or equal to zero | 0 | plot_left_margin="100" |
| plot_right_margin | Right margin of the plot in number of pixels relative to the border | Any whole number greater than or equal to zero | 0 | plot_right_margin |
| breakdown | How to breakdown the statistics in the chart | Any valid breakdown method | date | breakdown="program" |
| period | What period to display the chart for | Any valid period I.D. | 0 | period="7" |
| fields | The variables that the line graph is based on | A variable in $stats[$range] | none | fields = joins,recurring,refunds,reversals |
| field_titles | The line graph titles | any string | none | field_titles = Joins,Rebills,Refunds,Reversals |
| fields2 | The variables that the bar graph is based on. | A variable in $stats[$range] | none | fields2 = join_submits,join_hits,impression |
| field_titles2 | The bar graph titles | any string | none | field_titles2 = Submits,Join Hits,Raw Hits |
| show_legend | Show legend or not. | 0 (hide) or 1 (show) | 0 | show_legend = 1 |
| name | Name of the graph | Any HTML encoded string | Random | name="my_chart" |
| reference_date | The reference point for the start and end dates. | Any valid free formed date. | now | reference_date='last Thursday' |
| loginid | I.D. of the user to get data for | Any valid user I.D. | Current user's I.D. number | loginid="123" |
Output
A graph that is generated from the parameters supplied to the display_graph template function.
For example:
{display_graph width=988 height=290 type=TMM plot_width=896 plot_height=240 plot_bgcolor=0xFFFFFF bgcolor=0xDDDDDD
edge_color=0x000000 stats=$stats[$range] chart_type=TMM fields=joins,recurring,refunds,reversals breakdown=$range
field_titles=Joins,Rebills,Refunds,Reversals field_titles2="Submits,Join Hits,Raw Hits" field_color0=0xffaa71
field_color1=0xdd8851 field_color2=0xaa0000 fields2=join_submits,join_hits,impression field_color20=0x91b1d7
field_color21=0x7191b7 field_color22=0x517191 legend_x=45 legend_y=-2 left_margin=40 top_margin=26 show_legend=1
name=$name plot_edge_color=0xe5e5e5 plot_hgrid_color=0xe5e5e5 xaxis_tick_color=0xd3dde8 yaxis_label_offset=0
xaxis_label_gap=0}
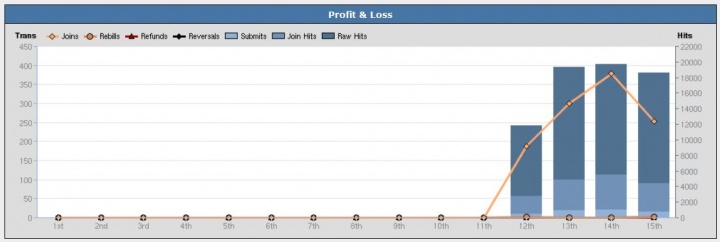
The Smarty template function call above will display a graph that has a bar graph component and a line graph component as defined by the "fields1" and "fields2" parameters as shown below.
Notes
The reference date refers to the date that the start date and the end date (in the date range form) use as a reference point.
For example:
Setting reference_date = 'today' and start_date to 'last Thursday' will set start_date to last Thursday relative to today.
The end date uses the reference_date as a reference point in the same way.
