Nats display graph
From TMM Wiki
Jump to navigationJump to searchnats_display_graph
Displays a graph of affiliate statistics.
Alias: display_graph
Parameters
(Required parameters in bold)
| Parameter | Description | Possible Values | Default Value | Example |
|---|---|---|---|---|
| width | Width of the graph in pixels | Any whole number greater than 0 | 400 | width="800" |
| height | Height of the graph in pixels | Any whole number greater than 0 | 250 | height="800" |
| period | The period to get statistics for | Any valid period number | 0 | period="7" |
| stats | The variable to get statistics from | An array | $stats[$range] | stats=$stats['date'] or $stats['site'] |
| bgcolor | The background color for the graph | Any background color specification | 0xe7e9eb | bgcolor="green" |
| plot_bgcolor | Background color for the plot | Any background color specification | Transparent | bgcolor="blue" |
| img_width | Width of the image in pixels | Any whole number greater than zero | Same as width parameter above | img_width="800" |
| img_height | Height of the image in pixels | Any whole number greater than zero | Same as height parameter above | img_height="800" |
| plot_width | Width of the plot in pixels | Any whole number greater than zero | Same as width parameter above | plot_widht="800" |
| plot_height | Height of the plot in pixels | Any whole number greater than zero | Same as height parameter above | plot_height="800" |
| legend_bgcolor | Background color of the legend | Any color specification | Transparent | legend_bgcolor="green" |
| plot_left_margin | Left margin of the plot in number of pixels relative to the border | Any whole number greater than or equal to zero | 0 | plot_left_margin="100" |
| plot_right_margin | Right margin of the plot in number of pixels relative to the border | Any whole number greater than or equal to zero | 0 | plot_right_margin |
| breakdown | How to breakdown the statistics in the chart | Any valid breakdown method | date | breakdown="program" |
| period | What period to display the chart for | Any valid period I.D. | 0 | period="7" |
| fields | The variables that the line graph is based on | A variable in $stats[$range] | none | fields = joins,recurring,refunds,reversals |
| field_titles | The line graph titles | any string | none | field_titles = Joins,Rebills,Refunds,Reversals |
| fields2 | The variables that the bar graph is based on. | A variable in $stats[$range] | none | fields2 = join_submits,join_hits,impression |
| field_titles2 | The bar graph titles | any string | none | field_titles2 = Submits,Join Hits,Raw Hits |
| show_legend | Show legend or not. | 0 (hide) or 1 (show) | 0 | show_legend = 1 |
| name | Name of the graph | Any HTML encoded string | Random | name="my_chart" |
| loginid | I.D. of the user to get data for | Any valid user I.D. | Current user's I.D. number | loginid="123" |
Output
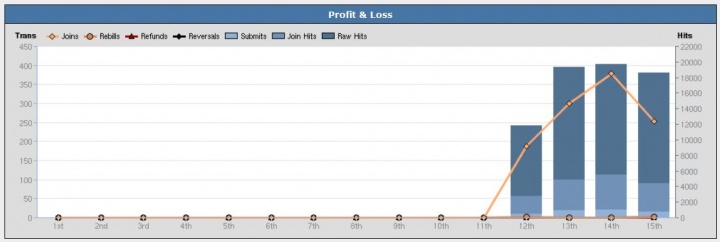
A graph that is generated from the parameters supplied to the display_graph template function.
For example:
{display_graph width=988 height=290 type=TMM plot_width=896 plot_height=240 plot_bgcolor=0xFFFFFF bgcolor=0xDDDDDD
edge_color=0x000000 stats=$stats[$range] chart_type=TMM fields=joins,recurring,refunds,reversals breakdown=$range
field_titles=Joins,Rebills,Refunds,Reversals field_titles2="Submits,Join Hits,Raw Hits" field_color0=0xffaa71
field_color1=0xdd8851 field_color2=0xaa0000 fields2=join_submits,join_hits,impression field_color20=0x91b1d7
field_color21=0x7191b7 field_color22=0x517191 legend_x=45 legend_y=-2 left_margin=40 top_margin=26 show_legend=1
name=$name plot_edge_color=0xe5e5e5 plot_hgrid_color=0xe5e5e5 xaxis_tick_color=0xd3dde8 yaxis_label_offset=0
xaxis_label_gap=0}
The Smarty template function call above will display a graph that has a bar graph component and a line graph component as defined by the "fields1" and "fields2" parameters as shown below.
Notes
None.
