Difference between revisions of "NATS5 Getting Started with Reporting"
| Line 5: | Line 5: | ||
| − | The NATS5 Reporting Admin offers quick access to all the statistics within your program. There are multiple [[ | + | The NATS5 Reporting Admin offers quick access to all the statistics within your program. There are multiple [[NATS5_Report_Types|Report Types]] available that can be Customized and Saved to best suit your needs. |
Latest revision as of 08:30, 4 October 2021
The NATS5 Reporting Admin offers quick access to all the statistics within your program. There are multiple Report Types available that can be Customized and Saved to best suit your needs.
NATS5 Report Features
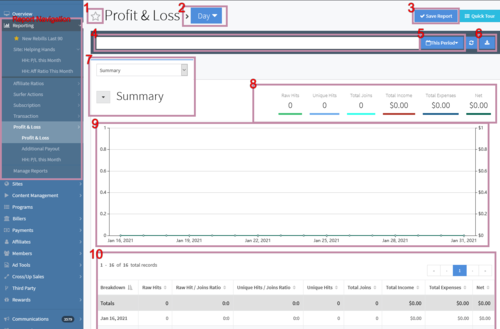
You will find standard features across each report in your NATS5 reporting admin:
- 1: Mark As Favorite - Marking a report as a "favorite" will add it to the top of the report list in the left-hand navigation.
- 2: Breakdown - The report breakdown defined how data is grouped within your table (and graph if applicable).
- 3: Save Report - Saving your report will save all the settings (search, breakdown, period, Focus, etc.), and will add a link to the saved report to your left-hand navigation.
- 4: Advanced Search Filter - Clicking the large textbox on the page will allow you to add search parameters to filter your report data easily.
- 5: Period / Date Range - The date range of your search criteria
- 6: Dump Report Data - This will provide a CSV dump of the data within your report.
- 7: Report Focus - A Focus is the collection of Data displayed in your Graph and Table. You can add your own Focus, and switch between them.
- 8: Enable/Disable Graph Points - Clicking any of the data points displayed above the graph will toggle the respective data within the graph below.
- 9: Report Graph / 10: Report Table - A visual representation of the data within your report.
- The data points here are defined by the Focus used by this report.
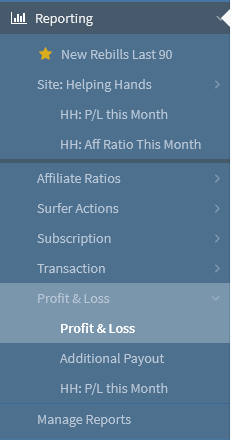
- Report Navigation - Saving a report will add that report into your left navigation list. Marking a report as a Favorite will add it to the top of the list.
Filtering Your Report Data
Advanced Search Bar
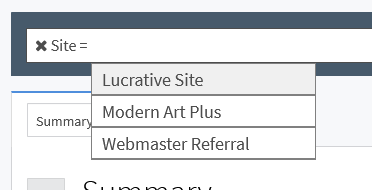
The Advanced Search Filter allows you to refine your search results using a simple menu system to select your search criteria. To get started:
- Click the text box and a menu will appear.
- Using your mouse, finger, or the Up and Down arrows will allow you to select your search parameter. For example, "Site".
- Next, select your comparison operator. Depending on your search parameter, you may see:
- = (equal)
- like
- > (greater than)
- Select (or type) your search value. For example, the name of a Site.
Once selected, the search parameter will be applied, and the data in your report will be automatically refreshed.
Period / Date Range
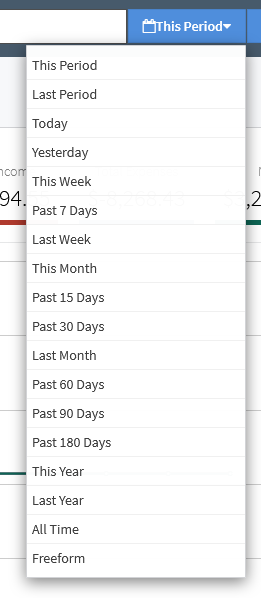
You can also set the Date Range of the data to include in your report by clicking the Period button next to the Advanced Search box:
Many common date ranges are included within the period menu, like This Period, Last 30 Days, Last Month, etc. But you can also specify a date range by clicking Free Form at the bottom of the menu.
Report Focus / Graph and Table Data
The data points displayed in the graph and table of a report (like Raw Hits or Total Expenses) is called a Focus. NATS comes with one or more specific Focuses for each report type. For example, your Profit and Loss report includes:
- Summary focus: This provides a simple summary of all your profit and loss data.
- Data Points: Raw Hits, Raw Hit / Joins Ratio, Unique Hits, Unique Hits / Joins Ratio, Total Joins, Total Income, Total Expenses, Net
- Traffic focus: This provides details about the new surfer traffic and new signups
- Data Points: Raw Hits, Unique Hits, Initial, Initial Amount, Trial, Trial Amount, Total Joins, Total Income, Total Expenses, Net
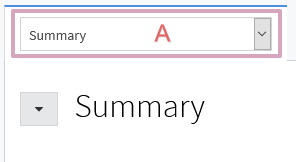
You can switch between the Focuses within your report by clicking the select box above the name.
Customize Focus
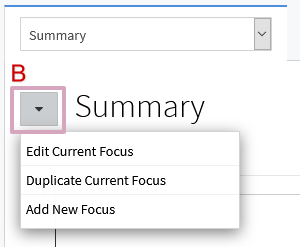
NATS comes with a few specific Focuses, as noted above. You can also add your own to include whatever data points work best for your reporting needs. To get started, click the button next to your currently loaded Focus.
From here, you will be able to:
- Edit this Focus
- Duplicate your Focus
- Add a new focus
Customize Modal
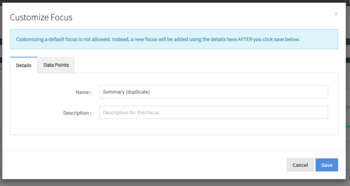
Clicking the button to the left of the name of the Focus will display a list of actions. No matter which you click, a modal will be displayed with two tabs:
Details Tab
This tab will allow you to set the name of your Focus, as well as a description.
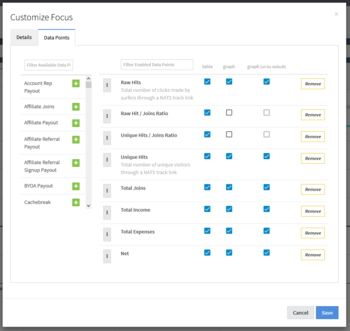
Data Points Tab
This tab allows you to select the data points for that Focus.
- Data Points Available (left column) - The left column in the modal shows all the data points (like Raw Hits or Total Expenses) available for this report type.
- Typing in the text box above the list will narrow the data point list.
- Clicking the plus icon (+) next to a data point will allow you to Enable/Add that data point to your Focus. Visually, you will see if added to the right column within the modal.
- Enabled Data Points (right column) - This will show you all the data points that have been added to this Focus.
- You can change the data points' order by moving them up and down within your list. This will change the order in which they are displayed in your table and graph.
- You can enable the data point in the Table or the Graph (if applicable) by checking off the respective checkbox.
- Not all data points can be displayed in the graph.
- You can remove that data point from your Focus altogether if you click the Remove button.
A few things to note:
- You can not edit a focus that comes with NATS. For example, the Summary Focus on the Profit and Loss report.
- You can not add a Focus with the same name as another Focus already in your system.
- You must click the Save button for your changes to take effect.
- Any Focus you create will be available for all the users with access to your reporting admin.
Marking a Report as a Favorite
Marking a report as a Favorite will give you easy access to this report by placing it at the top of the report list in the left-hand navigation. Besides marking a report as a favorite, you can also create your own report Groups that show up at the top of the left-hand navigation.
To mark a report as a Favorite, click the Star icon to the left of any report you are viewing.
Saving a Custom Report
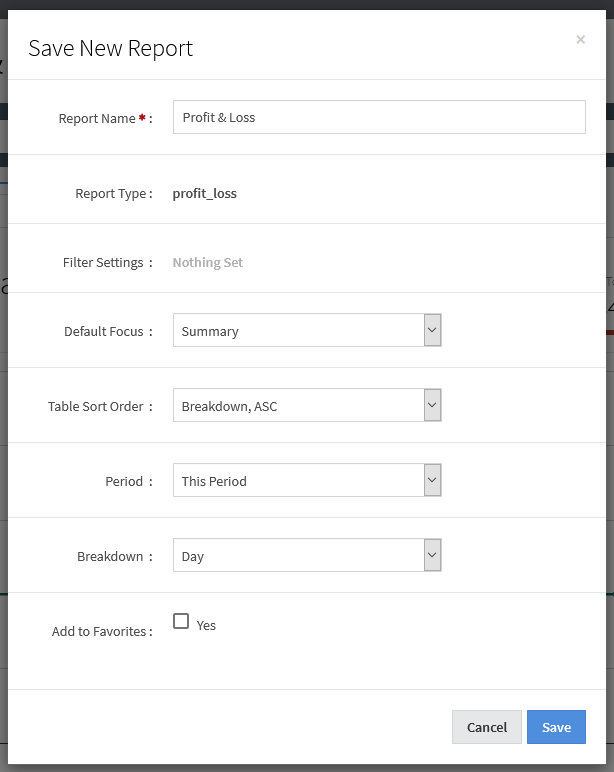
You can save your current search filters, date range, data breakdown, and even your default Focus into a new custom report for quick access in the future.
You can also save as many reports as you like. For example:
- Create a Profit and Loss report for a specific Affiliate Group, broken down by affiliates, for the last 90 days, using a focus with specific data about their sales.
- Create a Profit and Loss report for a specific Site and a specific Biller, using a focus with specific data about negative transaction types.
To start:
- Navigate to the report you may want to save. For example, the Profit and Loss report.
- Change your search filter, breakdown, etc., to what you would like to include in your report.
- Click the Save Report button in the top right of the page. A modal window will appear:
Once saved, the new report will be added to your report navigation list. And if you marked your new report as a Favorite, you will see a quick link to the news report at the top of the report navigation list.
Updating a Custom Report
You will be able to use your custom report just like any other report in your system. You can:
- Change the filters
- Update the date range
- Switch to a new focus
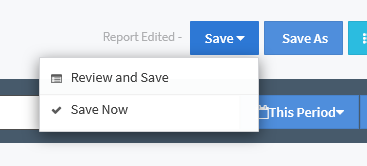
If you change a setting when on a custom report, you may see a change to the buttons on the top right side of your report page. For example:
This will let you know of a change to the report and allow easy access to review the changes, save the changes without review, or save your report as something new.
