Difference between revisions of "New NATS4 Affiliate Statistics"
TMMStephenY (talk | contribs) (Created page with '{{ NATS4 Changelog | image = Affiliate statistics report.png | caption = The New NATS4.1 Affiliate Stats }} The new NATS4.1 Affiliate Statistics pages give you even more dat…') |
TMMStephenY (talk | contribs) m |
||
| Line 65: | Line 65: | ||
[[Image:Breakdown by.png|thumb|center|319px|Breaking Down Your Statistics Reports]] | [[Image:Breakdown by.png|thumb|center|319px|Breaking Down Your Statistics Reports]] | ||
| + | |||
| + | [[Category:NATS4.1 Upgrade Changelog]] | ||
Latest revision as of 16:40, 24 May 2011
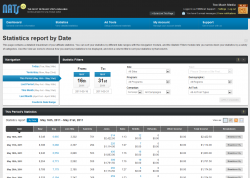
The new NATS4.1 Affiliate Statistics pages give you even more data about your referrals than before, presented in an intuitive and useful way to help you promote sites more effectively.
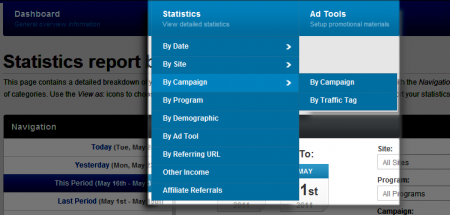
New Menu Structure
The new multi-level menu structure featured in NATS4.1 lets you go directly to the affiliate statistics report that you want to view. You can go to any available report, including specific report pages, by clicking on any of the links that appear after mousing over "Statistics" in the top menus.
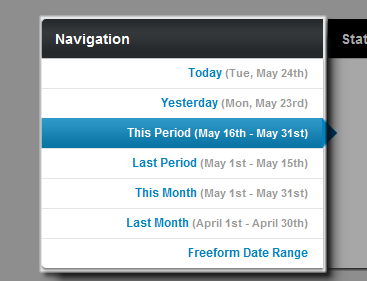
Choose a specific date range you want to view your affiliate statistics from, or input a freeform date to view statistics from any date range.
Statistic Filters
Narrow down your displayed affiliate statistics with a wide variety of parameters. The filters available here include site, tour, program, demographic, campaign, ad tool, and date.
View As: Icons
Use the icons on this page to switch between viewing your displayed statistics as a Table, as a Graph, as an RSS Feed, or as an XML Dump.
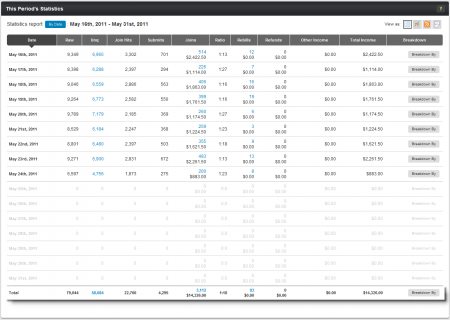
Table View
Use the View As: icons to see a detailed report of your affiliate statistics in a table. Click any column header to sort your results by that statistic, and use the "Breakdown By" icons to break down your report by a variety of statistics.
Line Graph View
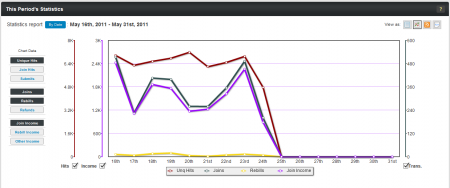
Use the View As: icons to see a graphical report of your affiliate statistics, shown as a Line Graph. Click any icon under Chart Data to display a graph for that statistic, and click the checkboxes for each graph to toggle that graph on and off. This view is available on the Statistics By Date report.
Pie Chart View
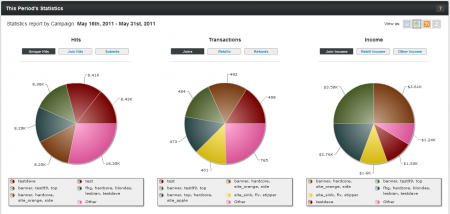
Use the View As: icons to see a graphical report of your affiliate statistics, shown as a Pie Chart. Click any of the icons above the pie charts to display that statistic in your selected chart, and click any of the pie chart sections to isolate them from the rest of the chart. This view is available on the Statistics By Site, Statistics By Campaign, Statistics By Program, Statistics By Demographic, and Statistics By Ad Tool reports.
Demographic View
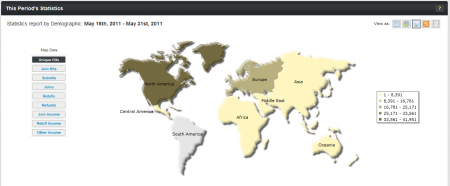
Use the View As: icons to see a graphical report of your affiliate statistics, shown in a Demographic Map. Click any of the "Map Data" icons to change the statistic that is displayed, and click on any of the displayed regions to see a more specific breakdown of surfers from countries in that region. This view is available on the Statistics By Demographic report.
RSS Feed/XML Dump
Click the "View as an RSS Feed" View As: icon to download a record of your statistics in RSS form. This lets you receive instant updates of your referral statistics. Clicking the "Export as XML" View As: icon downloads a dump of your affiliate statistics in XML format.
Breakdown By
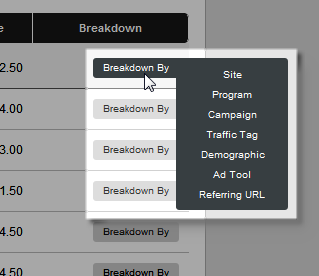
These icons, found in the Table View, let you break down any of your statistics reports by Date, Site, Campaign, Traffic Tag, Demographic, Ad Tool, and Referring URL. Mouse over the icon, then click the breakdown you want to view.
