Difference between revisions of "NATS5 Admin Overview"
| Line 29: | Line 29: | ||
*'''Pie Graph''': The performance information, specified by the data option chosen, can be presented in a pie graph. If hovered over by the cursor, the graph will display specific numbers for that site, affiliate, or program.<br /> | *'''Pie Graph''': The performance information, specified by the data option chosen, can be presented in a pie graph. If hovered over by the cursor, the graph will display specific numbers for that site, affiliate, or program.<br /> | ||
[[File:Admin-Overview_Performance_Pie_Graph.jpg|400px]] | [[File:Admin-Overview_Performance_Pie_Graph.jpg|400px]] | ||
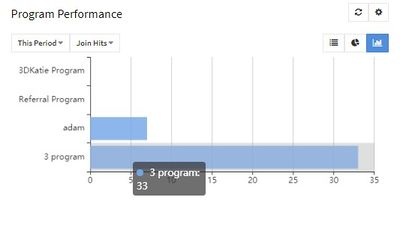
| − | *'''Bar Graph''': You can view the information based off the data option in a bar graph that can also be hovered over to view specific | + | *'''Bar Graph''': You can view the information based off the data option in a bar graph that can also be hovered over to view specific information and statistics. <br /> [[File:Admin-Overview_Performance_Bar_Graph.jpg|400px]] |
Revision as of 14:38, 11 July 2019
The NATS5 Admin Overview displays newly designed charts of your program's activity that can be customized by the admin, as well as vital statistics for your NATS program.

The top of the page shows a chart that displays four different data statistics that are fully customizable by the admin. To customize this, click on the gear at top right corner of the graph, and click "Customize" to choose the date range for the chart, as well as what data you would like displayed. Then, simply click on the data at the top left of the charts and the chart will automatically display that chosen data. Clicking the calendar will allow you to customize the date range that the chart displays.
Under "Real Time" is a separate chart that will automatically update and display join hits in real time. This chart can be customized by clicking on the gear at the top right of the chart, where the refresh rate and the default time range can be customized to as little as a refresh rate of 5 seconds and a default time range of up to an hour.
The "Engagement" section displays various statistics based on a specific and customizable time period. These statistics include Affiliate Joins, Free, Trial, Initial, Conversion, Rebill, Credit, Chargeback, Net, Total Expenses, and Total Income.
Statistics

The bottom half of the Admin Overview page includes several various tables that display your NATS statistics, including Newest Affiliates, Newest Members, Site Performance, Affiliate Performance, and Program Performance.
Newest Affiliates and Newest Members simply display the most recently joined affiliates and members.
Site Performance, Affiliate Performance, and Program Performance: Sorting and Display
The following statistics are all newly added to the Admin Overview page and have customizable features that allow you to view your information in any way you want. Their sorting options, located in the top left of the performance boxes, include:
- Period: The time period can be set to various different periods, including Today, Yesterday, This Period, Last Period, Last 7 Days, Last 30 Days, This Week, Last Week, This Month, and Last Month.
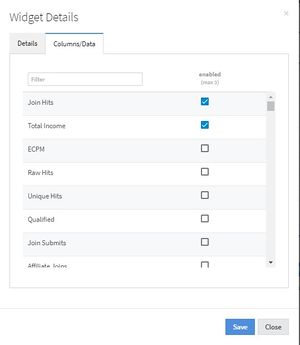
- Data: You can choose to sort the information based off of the data you choose. This data can be chosen by clicking the customize button (the gear in the top right corner of the performance box), and clicking the "Columns/Data" tab, where a maximum of 3 data columns can be chosen.
- Ascending, Descending: All of the data can be sorted either by ascending or descending order.

The data in each performance box can also be displayed in various different ways. These options, located in the top right of the performance boxes, include:
- Table: You can view all of the information in an organized table that allows for sorting options in ascending or descending order, as well as sorted by choice of data.
- Pie Graph: The performance information, specified by the data option chosen, can be presented in a pie graph. If hovered over by the cursor, the graph will display specific numbers for that site, affiliate, or program.

- Bar Graph: You can view the information based off the data option in a bar graph that can also be hovered over to view specific information and statistics.

(All of the information will be automatically updated once clicked, or the refresh button can manually update the information.)
Decode NATScode


The "Decode NATScode" box, located with all of the statistic boxes, is a newly designed feature similar to the NATS4 "Decode NATS Linkcode" feature. To use, enter a NATScode into the text box and press the "Decode" button. The decoded NATScode will specify the Affiliates, Campaign, Program, Ad Tool ID, Site, Tour, Sub ID 1, and Sub ID 2 associated with it. Clicking the "X" button will clear that NATScode to enter a new one. Clicking the green button will redirect you to a specific page completely dedicated to the "Decode NATScode" feature.